ELK简介
-
Elasticsearch是什么?
-
Logstash是什么?
-
kibana是什么?
安装JDK
- 请参照安装JDK
安装Logstash
- 关闭防火墙
service iptables stop chkconfig iptables off vi /etc/sysconfig/selinux SELINUX=disabled SELINUXTYPE=targeted - 在 https://www.elastic.co/downloads 下载Logstash tar包
- 解压并安装到制定位置
tar -zxvf logstash-6.1.2.tar.gz -C /usr/local/ mv logstash-6.1.2/ logstash - 测试logstash是否安装正确:
bash [root@elk-node1 local]# /usr/local/logstash/bin/logstash -e 'input { stdin { } } output { stdout {} }' Sending Logstash's logs to /usr/local/logstash/logs which is now configured via log4j2.properties [2018-01-24T18:22:01,209][INFO][logstash.pipeline ] Starting pipeline {:pipeline_id=>"main", "pipeline.workers"=>1, "pipeline.batch.size"=>125, "pipeline.batch.delay"=>5, "pipeline.max_inflight"=>125, :thread=>"#<Thread:0x2408e753 run>"} [2018-01-24T18:22:11,408][INFO][logstash.pipeline ] Pipeline started {"pipeline.id"=>"main"} The stdin plugin is now waiting for input: [2018-01-24T18:22:11,815][INFO][logstash.agent ] Pipelines running {:count=>1, :pipelines=>["main"]} hello world 2018-01-24T10:24:04.516Z 0.0.0.0 hello world - 创建logstash配置文件目录
mkdir /usr/local/logstash/etc/ vi logstash-simple.conf input { stdin { } } output { elasticsearch {hosts => "10.2.1.103" } stdout { codec=> rubydebug } } - 对logstash进行测试
      [root@elk-node1 local]# /usr/local/logstash/bin/logstash -f /usr/local/logstash/etc/logstash-test.conf
      [2018-01-25T14:06:35,448][INFO ][logstash.pipeline        ] Pipeline started {"pipeline.id"=>"main"}
      The stdin plugin is now waiting for input:
      [2018-01-25T14:06:35,854][INFO ][logstash.agent           ] Pipelines running {:count=>1, :pipelines=>["main"]}
      hello world
      {
            "@version" => "1",
             "message" => "hello world",
          "@timestamp" => 2018-01-25T06:06:59.308Z,
                "host" => "0.0.0.0"
      }
安装Elasticsearch
- 在 https://www.elastic.co/downloads 下载Elasticsearch tar包
- 需注意安装Elasticsearch不能使用root账户,要使用普通用户进行测试
- 需要创建用户及开通权限请参照Linux使用命令
- 解压并授予普通用户权限
[root@elk-node1 download]# tar -zxvf elasticsearch-6.1.2.tar.gz -C /usr/local/ [root@elk-node1 local]# mv elasticsearch-6.1.2/ elasticsearch [root@elk-node1 local]# chown -R appuser.appuser /usr/local/elasticsearch/ [root@elk-node1 local]# su appuser - 编辑Elasticsearch配置文件
[appuser@elk-node1 elasticsearch]$ vi config/elasticsearch.yml bootstrap.memory_lock: false bootstrap.system_call_filter: false cluster.name: cluster-test node.name: node-2 path.data: /tmp/elasticsearch/data path.logs: /tmp/elasticsearch/logs network.host: 10.2.1.104 http.port: 9200 - 启动Elasticsearch
[appuser@elk-node1 elasticsearch]$ ./bin/elasticsearch & - 解决安装Elasticsearch过程中出现的问题
[1]: max file descriptors [4096] for elasticsearch process is too low, increase to at least [65536] [2]: max number of threads [1024] for user [appuser] is too low, increase to at least [4096] [3]: max virtual memory areas vm.max_map_count [65530] is too low, increase to at least [262144] [4]: system call filters failed to install; check the logs and fix your configuration or disable system call filters at your own risk - 切换至root用户下,解决问题[1]
[root@elk-node1 ~]# vi /etc/security/limits.conf * soft nofile 65536 * hard nofile 131072 * soft nproc 4096 * hard nproc 4096 - 解决问题[2], 修改如下
[root@elk-node1 ~]# vi /etc/security/limits.d/90-nproc.conf * soft nproc 4096 root soft nproc unlimited - 解决问题[3], 修改如下,并执行生效命令
      [root@elk-node1 ~]# vi /etc/sysctl.conf
      vm.max_map_count=655360
      [root@elk-node1 ~]# sysctl -p
安装Kibana
- 在 https://www.elastic.co/downloads 下载Kibana tar包
- 解压并安装到制定位置
[root@elk-node2 download]# tar -zxvf kibana-6.1.2-linux-x86_64.tar.gz -C /usr/local/ [root@elk-node2 local]# mv kibana-6.1.2-linux-x86_64/ kibana - 配置kibana
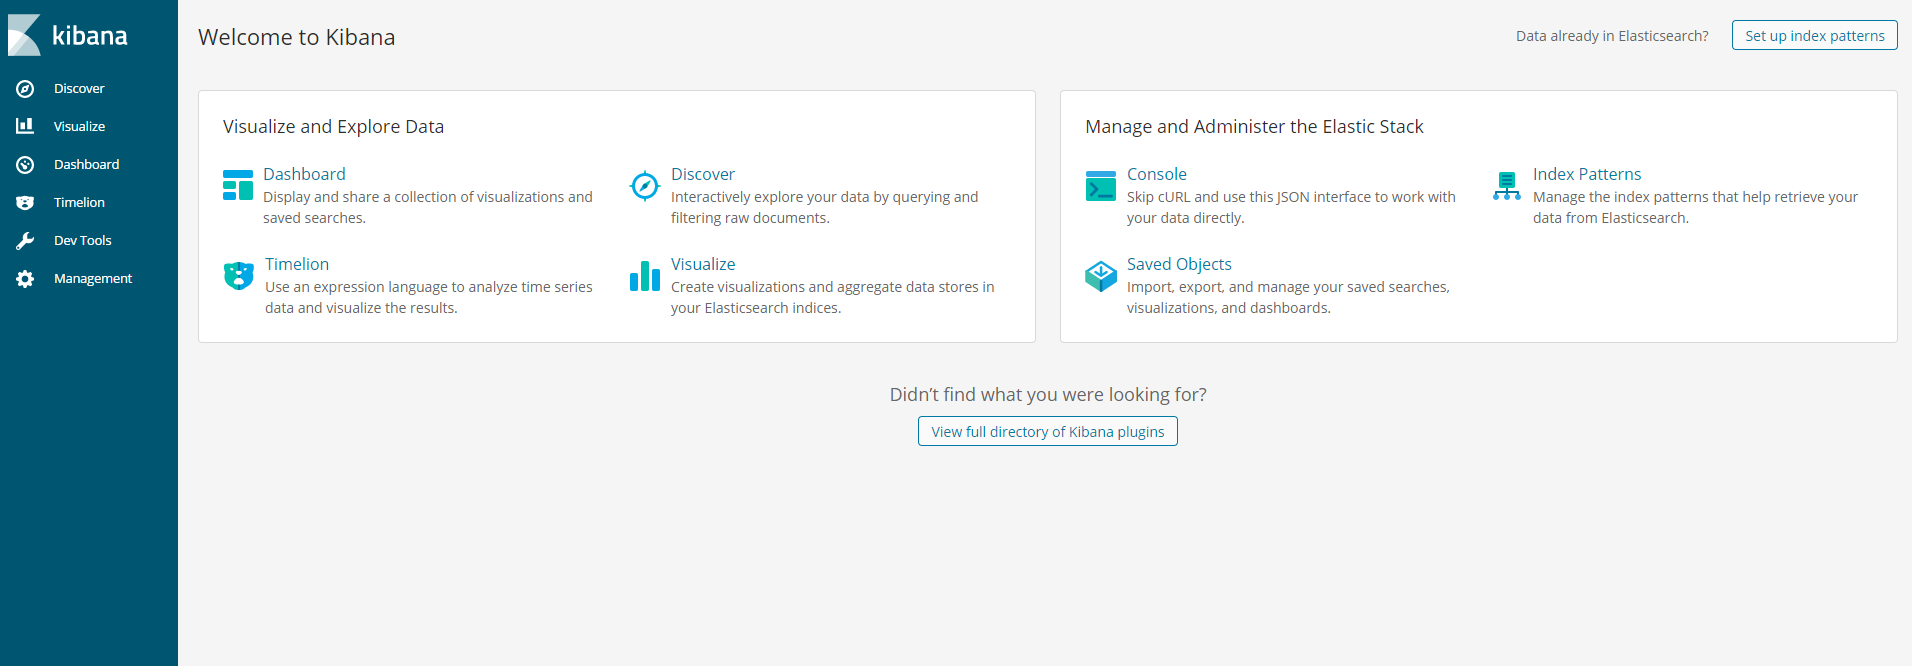
[root@elk-node2 kibana]# vi config/kibana.yml server.port: 5601 server.host: "10.2.1.103" elasticsearch.url: "http://10.2.1.103:9200" kibana.index: ".kibana" - 启动Kibana验证安装正确,启动如无报错,浏览10.2.1.103:5601 即可